Category Archives: Tak Berkategori

SOCIO-ECONOMIC FACTOR THAT INFLUENCING FARMING BEHAVIOUR AND FARMER PATICIPATION LEVEL ON ENVIRONTMENTAL MANAGEMENT IN BAUMATA VILLAGE DISTRICT OF KUPANG

ABSTRACT

By

Ermantje Hendrik; M R Pellokila and L M Riwu Kaho

In an attempt to increase agricultural productivity and environtment, it is important to understand farmers’ behaviour and participation in agri-environmental management. farmers’ behaviour has attracted considerable attention, because it has both environmental and socio-economic benefits, if the agri-environmental practices are sustainable or not sustainable. The study was conducted to analyze the influence of sosio-economic factor on farming behaviour and participation in agri-environmental management in Baumata village, Kupang District. The aims of this research are : 1). To study sosio-economic factors influencing farmer behaviour and participation 2). To find out the relationship between farming behaviors and participation through environmental management. This research was a survey study of descriptive method, with samples were farmers who were live and have farming in Baumata Village. The respondents were 75 farmers household chosen with a ramdom sampling technic. Data analysis were conducted with Chi Square methods and Spearman Rank Correlation. Results showed that farming behaviours mean score was 17,84 in range of medium category, and the socio-economic characteristics that influenced farmer’s behaviour in agricultural activities were : age (χ2= 10,306; df = 2; p = 0,006), farming experience (χ2 = 10,720; df = 2; p = 0,005) and income (χ2 = 10,505; df = 2; p = 0,005); while the socio-economic characteristics thats not influenced farmer’s behaviour in agricultural activities were : education (χ2 = 2,725; df = 4; p = 0,605), family size (χ2= 5,096 ; df = 4; p = 0,278). Participation in environmental management mean score was 17,33 in range of medium category, there are no socio-economic characteristics that influenced farmer’s participation, while the socio-economic characteristics thats not influenced farmer’s Participation in environmental management were : age (χ2 = 2,995; df = 2; sig = 0,224 ), education (χ2 = 4,504; df = 2; p = 0,105). Family size (χ2 = 0,667; df = 2; p = 0,716), farming experience (χ2 = 2,575; df = 2; p = 0,276) and income (χ2 = 2,150; df = 4; p = 0,341)
Spearman Rank Correlation test result showed that there were significant relation between farming behaviours with level of Participation in environmental management (rs = 0,383; p = 0,001)


Keywords: Socio-economic factor, farming behaviour, paricipation level, environment management .

Ermantje Hendrik (Erna Hendrik)

Original source:  http://ejournal.undip.ac.id/index.php/ilmulingkungan/article/view/10552

Leave a comment

Filed under Tak Berkategori

RENCANA KEGIATAN PEMBELAJARAN SEMESTER (RKPS) MATA KULIAH : DASAR-DASAR KOMUNIKASI

RENCANA KEGIATAN PEMBELAJARAN SEMESTER

RKPS)

MATA KULIAH : DASAR –DASAR KOMUNIKASI

DI SUSUN OLEH : IR. ERMANTJE HENDRIK.MSi
Ernantje Hendrik (Erna Hendrik)

AGUSTUS 2016


GARIS BESAR MATA KULIAH

1. TUJUAN MATA KULIAH

  1. Tujuan mata kuliah ini adalah mahasiswa mempunyai kompetensi dalam bidang komunikasi, serta mampu menganalisis dan menguasai konsep-konsep daar komunikasi termasuk di dalamnya pengertian, komponen dan bentuk komunikasi, sifat komunikasi, proses dan model komunikasi. Disamping itu mhasiswa juga diharapkan akan memahami tentang metode dan teknik komunikasi serta strategi dalam komunikasi.
  2. Mengaplikasikan metode pembelajaran SCL dengan Model Pembelajaran Small Group Discussion, Discovery Learning (DL), Cooperative Learning (CL) dan Problem Based Learning and Inquiry.
  3. Menhasilkan lulusan yang mampu memimpin dan bekrjasama dalam kelompok –kelompok diskusi, dan menerapkan konsep-konsep dasar komunikasi dalam kehidupan se hari-hari.

2. KOMPETENSI YANG AKAN DICAPAI

Kompetensi dari mata kuliah Dasar-dasar Komunikasi yaitu : mahasiswa dapat menjelaskan peranan komunikasi dalam pertanian, mahasiswa dapat memahami dan menjelaskan tentang , komponen, bentuk dan  sifat komunikasi, menganalisis dan memahami metode dan teknik komunikasi serta strategi dalam komunikasi.

  1. KONSEP MATA KULIAH

Mata Kuliah Dasar-dasar Komunikasi adalah mata kuliah yang diajarkan pada mahasiswa jurusan Agribisnis semester I, mata kuliah ini dimulai dengan  mengajarkan tentang pengertian komuniksi, komponen-kompnen dalam komunikasi, proses dan model komunikasi, bentuk komunikasi dan sifat komunikasi. Selanjutnya pada juga di ajarkan tentang . Selanjutnya , juga dijelaskan tentang Metode, Teknik, Fungsi , Tujuan dan Strategi Komunikasi.Selain itu,  materi penting lain yang juga dibicarakan dalam mata kuliah Dasar-dasar Komunikasi adalah tentang Faktor-faktor pendorong dan penghambat Proses Komunikasi dan Komunikasi Pertanian.

  1. ISI MATA KULIAH

Isi Mata Kuliah  Dasar – Dasar Komunikasi terbagi atas pokok bahasan sebagai berikut

I. Pengertian Komunikasi

  1. Pengertian Komunikasi
  2. Komponen Komunikasi

II. Proses dan Model Komunikasi

  1. Proses Komunikasi
  2. Model Komunikasi

III. Bentuk dan Sifat Komunikasi

  1. Bentuk Komunikasi
  2. Sifat Komunikasi

IV. Metode dan tknik Komunikasi

  1. Metode Komunikasi
  2. Teknik Komunikasi

V. Fungsi dan Tujuan Komunikasi

  1. Fungsi Komunikasi
  2. Tujuan Komunikasi

VI. Strategi Komunikasi

  1. Fungsi strategi Komunikasi
  2. Faktor-faktor dalam strategi Komunikasi
  3. Merncanakan Strategi Komunikasi

VII. Faktor-faktor Pendorong dan Penghambat Komunikasi

  1. Faktor-faktor Pendorong Komunikasi
  2. Faktor-faktor Penghambat Komunikasi
  1. MATA KULIH PRASYARAT : Tidak ada
  1. RELEVANSI DENGAN MATA KULIAH LAIN

Mata Kuliah Dasar-dasar Komunikasi merupakan mata kuliah dasar sebelum mahasiswa memprogram mata kuliah Komunikasi Agribisnis, dan mata kuliah lainnya yang berkaitan seperti mata Kuliah Penyuluhan Pertanian dan mata kuliah Metode dan Media Penyuluhan.

  1. MATA KULIAH BERIKUTNYA : Komunikasi Agribisnis


Leave a comment

Filed under Tak Berkategori

foto BUKU baru

Leave a comment

Filed under Tak Berkategori

Proporsional Quota Sampling /27 April 2016/ Ermantje Hendrik

Proporsional Quota Sampling
27 April 2016
Ermantje Hendrik /Erna Hendrik
___________________________________________________
Penggunaan
Digunakan jika distribusi dari target populasi diketahui.
Digunakan jika untuk meyakinkan bahwa minoritas terwakili dalam studi

Metoda
Identifikasi kelompok yang akan digunakan sub bagian dan proporsi yang diketahui dari populasi dalam setiap kelompok
Kalikan persentase ini dengan total ukuran sample untuk memperoleh jumlah sample tiep kelompok
Contoh
Diketahui bahwa 70% dari petani sayur di suatu desa adalah perempuan. Suatu studi dengan ukuran sample 100 petani sayur, maka pilihlah 70 petani perempuan dan 30 petani sayur laki-laki.

Leave a comment

Filed under Sampling, Tak Berkategori

Uji Korelasi Statistik NonParametrik

BAB VI

Leave a comment

Filed under Tak Berkategori

Life is a clafoutis

The Go Lightly Gourmet

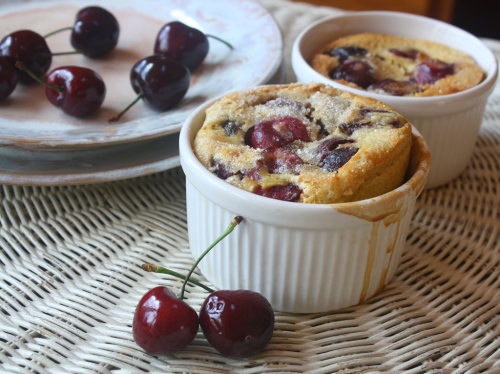
Cherry clafoutis Cherry clafoutis

“Life is just a bowl of cherries, don’t take it serious; it’s too mysterious” Lew Brown

Cherries just make me happy. I bought a bunch of cherries at the first farmer’s market of the season and when I started munching on them, the old song, “Life’s is just a bowl of cherries” came dancing into my head. The red juice was staining my fingers and I was chewing around the pits and spitting them out and thinking that song was spot on. Life doesn’t get much better.

We are in the height of cherry season here in the NW, with cherry stands popping up everywhere. This season is through July and is fast and furious as cherries are highly perishable. The State of Washington grows 40% of the country’s sweet cherries but what most people do not know is that Oregon has quite a history with cherries too…

View original post 849 more words

Leave a comment

Filed under Tak Berkategori

Chickens rule the roost and they don’t even know it

The Go Lightly Gourmet

“The chicken has, quietly but inexorably, become essential.” Donna J. Haraway

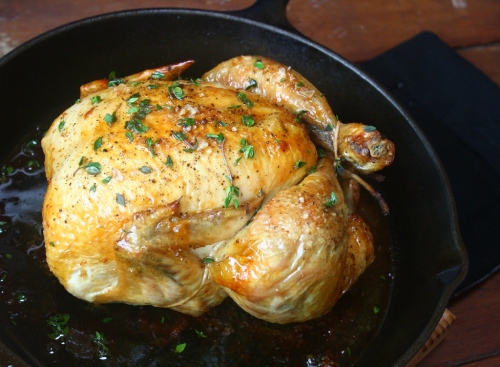
Thomas Keller's famous roast chicken Thomas Keller’s famous roast chicken

The egg comes before the chicken. At least that is how it is in my world. Edition before last, I wrote about the incredible edible egg and now we are going to focus on the humble chicken. Now this uncelebrated bird has some surprising facts to it. For instance did you know that if you added up all the world’s cats, dogs, pigs, cows and toss in all the rats for fun, there would still be more chickens on this earth?

Yes, it is true, this simple creature has captured the world and we don’t even know it. If it had a brain bigger than a walnut, it could rule. Chickens are 50 billion strong and on every continent in the world except Antarctica, and they still make it there in frozen entrees. (The…

View original post 839 more words

Leave a comment

Filed under Tak Berkategori

Getting reacquainted with Ancient Grains

The Go Lightly Gourmet

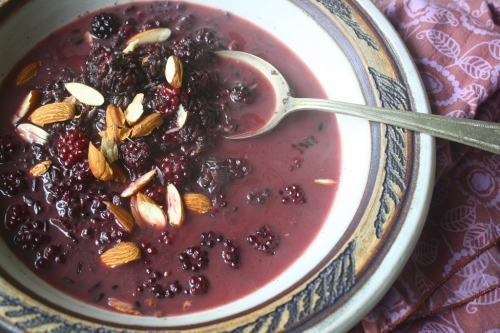
Beautiful black rice porridge made from ancient grains Beautiful black rice porridge made from ancient grains

In our fast paced age of information it is refreshing to engage in the practice of eating slow foods like ancient grains. In fact, the only thing fast about ancient grains are how fast they are catching on right now. They are so popular that Cheerios is actually putting out a cereal with a scant amount of ancient grains in them in hopes to revive their market. (Isn’t that a contradictory? Fast cereal with old slow grains??)

I have been eyeing this ancient grain movement with interest and curiosity. I mean I was cooking these grains back in my hippy momma days where I whipped out millet seed loafs with tomato gravy and handed out spelt cookies to all the neighborhood children in hopes of rescuing them from their Oreos. So this movement isn’t new to all of us, but Maria Speck’s…

View original post 667 more words

Leave a comment

Filed under Tak Berkategori

SOCIO-ECONOMIC FACTOR THAT INFLUENCING FARMING BEHAVIOUR AND FARMER PATICIPATION LEVEL ON ENVIRONTMENTAL MANAGEMENT IN BAUMATA VILLAGE DISTRICT OF KUPANG

By

Hendrik Ernantje; M R Pellokila and L M Riwu Kaho

Abstract

In an attempt to increase agricultural productivity and environtment, it is important to understand farmers’ behaviour and participation in agri-environmental management. Farmers’ behaviour has attracted considerable attention, because it has both environmental and socio-economic benefits, if the agri-environmental practices are sustainable or not sustainable.
The study was conducted to analyze the influence of sosio-economic factor on farming behaviour and participation in agri-environmental management in Baumata village, Kupang District. The aims of this research are : 1). To find out sosio-economic factors which influencing farming behaviour and participation 2). To find out the relationship between farming behaviors and participation through environmental management. This research was a survey study of descriptive method, with samples were farmers who were live and have farming in Baumata Village. The respondents were 75 farmers household chosen with a ramdom sampling technic. Data analysis were conducted with Chi Square methods and Spearman Rank Correlation
Results showed that farming behaviours mean score were 17,84 in range of medium category, and the socio-economic characteristics that influenced farmer’s behaviour in agricultural activities were : age (χ2= 10,306; df = 2; p = 0,006), farming experience (χ2 = 10,720; df = 2; p = 0,005) and income (χ2 = 10,505; df = 2; p = 0,005); while the socio-economic characteristics thats not influenced farmer’s behaviour in agricultural activities were : education (χ2 = 2,725; df = 4; p = 0,605), family size (χ2= 5,096 ; df = 4; p = 0,278).
Participation in environmental management mean score were 17,33 in range of medium category, there are no socio-economic characteristics that influenced farmer’s participation, while the socio-economic characteristics thats not influenced farmer’s Participation in environmental management were : age (χ2 = 2,995; df = 2; sig = 0,224 ), education (χ2 = 4,504; df = 2; p = 0,105). Family size (χ2 = 0,667; df = 2; p = 0,716), farming experience (χ2 = 2,575; df = 2; p = 0,276) and income (χ2 = 2,150; df = 4; p = 0,341)
Spearman Rank Correlation test result showed that there were significant relation between farming behaviours with level of Participation in environmental management (rs = 0,383; p = 0,001)

Keywords: Socio-economic factor, farming behaviour, paricipation level, environment management .

Leave a comment

Filed under Tak Berkategori

COCHRAN TEST

COCHRAN TEST – BAB IV pg 70

By:   Ernantje Hendrik (Ermantje Hendrik/ Erna Hendrik)

BAB IV
Uji Statistik NonParametrik
k Sampel Berkorelasi

A.Uji Cochran ( Q – Test )

a.Uji Cochran (Q–Test) tanpa Menggunakan Prodram SPSS

Uji ini digunakan untuk menguji tiga sampel berpasangan atau lebih, untuk melihat apakah frekuensi berpasangan tersebut saling terdapat perbedaan yang signifikan.Jika hipotesis nihil benar maka diharapkan sukses (1) dan gagal (0) ; ya (1) dan (tidak (0) ; akan menyebar secara random dalam baris ( i) dan Kolom (j).
Rumus yang digunakan dalam pengujian adalah :

  ( k – 1) [ k( ∑ C2j ) – ( ∑ Cj )2 ]
Q =
k ( ∑ Ri ) – ∑ R2i
dimana :
Q = Nilai untuk Cochran Test
k = Banyaknya Kolom
Cj = Jumlah Sukses dalam Kolom ke j (Columns)
Ri = Jumlah Sukses dalam Baris ke- i ( Rows)

Kriteria pengambilan keputusan

Terima H0 : Q ≤ X2tabel ( α; db(k-1) )
Tolak H0 : Q ≥ X2tabel ( α; db (k-1) )

Hipothesis yang akan diuji adalah :

H0 : Tidak Terdapat Perbedaan kemungkinan sukses dalam kondisi tertentu
H1 : Terdapat Perbedaan kemungkinan sukses dalam kondisi tertentu
Contoh :

Gunakan Uji Cochran Q k Sampel untuk menyelesaikan soal berikut :

60 orang petani yang mengikuti pelatihan penggunaan tehnik irigasi tetes dibgi dalam Tiga Group, petani diminta pendapatnya apakah setuju atau tidak setuju untuk menggunakan Teknologi irigasi tetes yang baru dperkenalkan di Desa mereka dan hasilnya adalah sbb:

Tabel 4.8. Tabel Data Group Petani yang mengikuti pelatihan penggunaan tehnik irigasi tetes
No. Group I    Group II       Group III
1.     1                 0                     1
2.     1                0                      1
3.     0                0                      1
4.     0                0                      1
5.     0                1                      1
6.     0                1                      1
7.     1                1                      1
8.     1                1                      0
9.     1                1                      0
10 .  0                0                      0
11 .  0                0                      0
12.   0                0                      1
13.   1                1                      1
14.   1                1                      1
15.   0                1                      0
16.   0                1                      1
17.   0                1                      0
18.   1                0                      1
19    0                0                      1
20.   0                1                      1

Ujilah apakah ada perbedaan respons terhadap penggunnaan irigasi tetes dengan taraf kesalahan 5%

Jawaban :

a.Hipothesis :

H0 : Tidak Terdapat Perbedaan respons petani terhadap penggunnaan irigasi tetes.
H1 : Terdapat Perbedaan respons petani terhadap penggunnaan irigasi tetes

b. Kriteria pengambilan keputusan

Terima H0 : Q ≤ X2tabel ( α; dk )
Tolak H0 : Q ≥ X2tabel ( α; dk )

c.Uji :

( k – 1) [ k( ∑ C2j ) – ( ∑ Cj )2 ]
Q =
k ( ∑ Ri ) – ∑ R2i
Sehingga tabel diatas dapat ditulis :
Tabel 4.9. Group Petani yang mengikuti pelatihan penggunaan tehnik irigasi tetes dengan Nilai Ri

No. Group I   Group II      Group III        Ri      Ri2
1.         1           0               1                  2       4
2.         1           0              1                   2       4
3.         0           0              1                   1        1
4.         0           0              1                   1        1
5.         0           1              1                   2        4
6.         0           1              1                   2        4
7.         1           1              1                   3        9
8.         1           1              0                   2        4
9.         1           1              0                   2         4
10.       0           0              0                   0         0
11.       0            0            0                    0         0
12.       0            0            1                    1         1
13.       1            1            1                    3         9
14.       1            1            1                    3         9
15.        0           1            0                    1          1
16.        0           1            1                    2          4
17.         0         1             0                    1          1
18.         1          0             1                   2          4
19          0          0             1                    1          1
20.          0         1             1                    2          4
Colom C1= 8 C2= 11 C3= 14 ∑ Ri = 33 ∑ Ri2 = 69
Hasil pada table tersebut selanjutnya dimasukkan pada formulasi untuk menghitung nilai Q sepreti berikut :
( k – 1) [ k ( ∑ C2j ) – ( ∑ Cj )2 ]
Q =
k ( ∑ Ri ) – ∑ R2i
( 3 – 1) [ 3 ( 82 + 112 + 142 ) – ( 33 )2 ]
Q =
3 ( 33 ) – 69

( 2 ) [ 3(381) – ( 1089 ) ]
Q = = 3,60
30

Dengan dk = k – 1 = 2, maka diperoleh
Chikuadrat table ( α = 0,05 ) = 5,59

Dari hasil diatas karena
nilai Q = 3,60 ≤ X2tabel = 5,59 maka H0 diterima dan H1 ditolak dengantingkat kepercayaan 95 %.

f .Kesimpulan

Dari Hasil Pengujian Diatas Dan Kriteria Keputusan Yang Dibuat Maka Dapat Disimpulkan respons petani………………..

b.Uji Cochran Menggunakan Program SPSS :

Selanjutnya Klik pada Variable View lalu input name, type, dan measure sesuai variable pengamatan :
Name : Sesuai data
Type : pilih Numeric
Measure : pilih Nominal
Yang lain biarkan sesuai default

Selanjutnya buka Data View lalu input Data :

Leave a comment

Filed under Tak Berkategori